 |
| Pub Dom Img adapted by SM |
Ascolta la puntata del podcast in italiano su
Listen to the podcast in Eng?ish here
here (on iTunes)
here (on SoundCloud)
here (on Podcast Machine)
The following text is that of the podcast
in Eng?ish
in Eng?ish
Ooooh, hallo dear English thinking-speaking-hearing listener, welcome to the podcast number five of me, @sciencemug , the twitter account/ blog that talks about science aaand at the same time dives into the warm ocean of its own inconsistency while duelling with karma in punta di fioretto.
Aaand that does all of this in Eng?ish that is English-question mark, the kind of language that is to real English what “The Martian” is to plausibility and a frappuccino to a good idea. (And a Martian sipping a frappuccino to something I never want to witness. Never.)
Sooo, right now, with the voice of the dumb human I control via a wireless-voodoo trick, I’m gonna tell you the tale of China’s capital megacity Beijing which stubbornly wears a powerful ring of pollution -ooh, my precioussss!- in spite of risking, like that, its own demise…
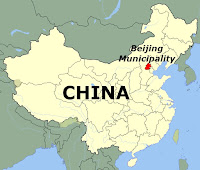
Mark Z. Jacobson, Son V. Nghiem, Alessandro Sorichetta and Natasha Whitney are four scientists from Stanford, Cal Tech and the University of Southampton who decide to investigate Beijing, the Chinese mega-capital city and the extent and consequences of its tumultuous urban expansion in the new millennium’s first decade.
Sooo, the four science pals, spearheaded by professor Mark Jacobson, who I’m gonna refer to MJ from now on, ‘cause, you know, I’m a big fan of Micheal Jordan and I’m sure he does like that a Stanford’s brain have the same initials of his, well prof MJ and his science buddies do two things.
One, they collect and analyze satellite and geo-located crowd-sourced data about the explosive urbanization of Beijing. Two they then evaluate the effects of such an expansion via a very sophisticated state of the art computer model.
And what they find, dear listener, it’s kinda eerie, ‘cause the Chinese city’s growth has created what the researcher call a “ring of impact”(P) that surrounds the city and it’s strangling it with environmental problems of all sort.
 |
| Ring of impact (by sciencemug) |
[The ring's pic is a Pub Dom Img adapted by sciencemug; source Wikimedia Commons]
But let’s start with phase one of our researchers’ study: the “collect and analyze data”.
MJ and colleagues need to build a data set that take into consideration the changes of Beijing’s urban coverage in space and time, the time being the 2000-2009 period. To do that, prof MJ’s science squad needs, over the Beijing area, a large high-resolution coverage over a long time, and this need rules out the possibility for the researchers to count on visual satellite data. Visual satellites in fact usually collects high-res data only sporadically in time and space, while they provide wide coverage data only at a low-resolution, that is not precise enough for a reliable study about urban and suburban environments’ changes.
Sooo, professor Jacobson starts asking himself: “Who I gonna call?” while hearing in his head a catchy pop song from the eighties and seeing, always in his head that must be a very intriguing place by the way, a little green blob bouncing around till he, the professor not the little green bouncing blob, and the science bunch have an epiphany and find a solution: they call NASA.
Well, indeed the story it’s not that epic but I think that dropping the space agency’s name is a good way to get your attention back, isn’t it true dear listener? Eh? Eh? Booobs! See that? Ryan Gosling’s abs! See that? NASA! See that? Eh? Aaanyway, dear listener, here’s the real story: prof MJ’s team decides to use NASA’s QuikSCAT satellite’s SeaWinds scatterometer data; then, to make sense of these data, the team processes them with “the dense sampling method” (aka DSM)(P) (1), an innovative method that can estimate urban extent and monitor urban changes over time; finally, done all of this, the researchers can eventually map Beijing’s urban and intraurban area with a resolution of about 1 km.
Wooa wooa wooa, my hyper geeky me, wait a minute wait-a-minute, slow down a bit and restate the last sentences of yours, please. In simple words. With calm. No rush. Make it clear.
Ok! Ok, my so called normal me, ok! So, there was this NASA’s spaceprobe, the QuickSCAT. QuickSCAT was a satellite orbiting Earth at about 800 kilometers of height, launched in 1999 and died of an age-related mechanical failure in 2009. QuickSCAT mission was to check the whole globe and measure near-surface wind speed and direction under all weather and cloud conditions over Earth's oceans. So, NASA’s satellite QuickSCAT, to do its job, mounted an instrument, called SeaWinds. This SeaWinds instrument was a scatterometer, that is a microwave radar, hence it measured its own backscatter, that is the reflection of signals back to the direction from which they come, meaning the radar itself. Which, in the case of SeaWinds, as you know already, was in orbit.
 |
| by sciencemug |
Anyway, we are done with the satellite and the radar stuff. Now let’s go to the “the dense sampling method” (aka DSM) which prof MJ and colleagues use to make sense of these satellite and radar data. DMS is math stuff, so I’m not even

